Evaluating Models
The function compare_dfs compares the real data set df and the artificially generated data set df_generated from the WGANs. The output are a comparison of means, comparisons of standard deviations, histograms and scatterplots to evaluate the performance of the WGAN.
wgan.compare_dfs(df, df_generated,
             scatterplot=dict(x=["continuous_var_1"], y=["continuous_var_2"],
             samples=400, smooth=0),
             table_groupby=["context_var"],
             histogram=dict(variables=["continuous_var_1", "continuous_var_2"],
             nrow=2, ncol=2),
             figsize=3)
Find below an example of a histogram produced by compare_dfs, from Athey et al. [2019].
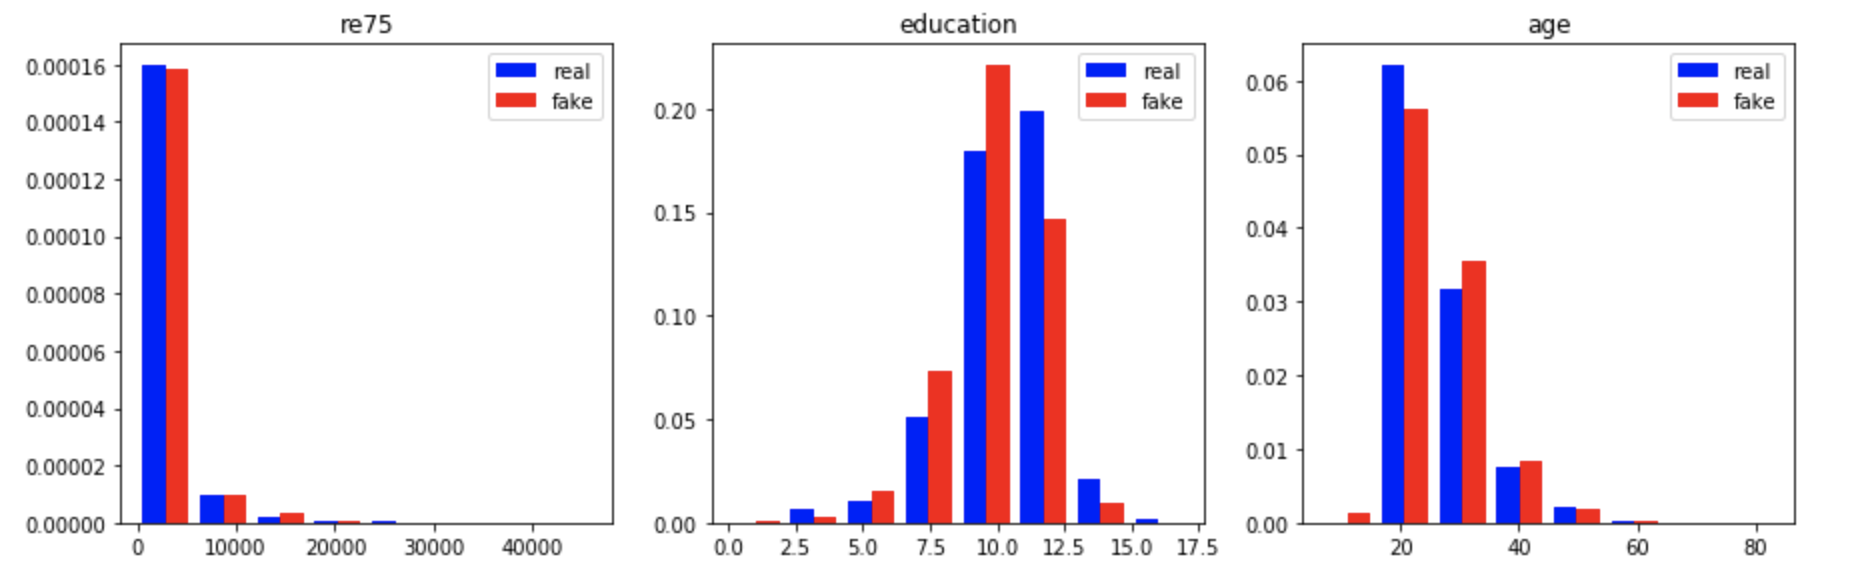
The figure shows the histograms for CPS data, Earnings 1975, education and age (Figure 3 in the paper). real refers to the distribution of the variable in the original data set
dfand fake refers to the distribution of the same variable in the artificially generated data setdf_generated.
See the function compare_dfs in the API for more details.